Collisions with rocks from space are hot news these days. rxdtxd posted the link to ESA Near Earth Objects risk table, I started playing with it since it was a new shiny distraction, and because we are quite oblivious to what the raw data has to say.
Humans are rather incapable at internalising numbers – we did not evolve to manage risks rationally. We skim over tables with horrifying observations (say, ocean acidification) and shrug, but duck and run from a tiger-shaped bush, because it suddenly seems so urgent and personal.
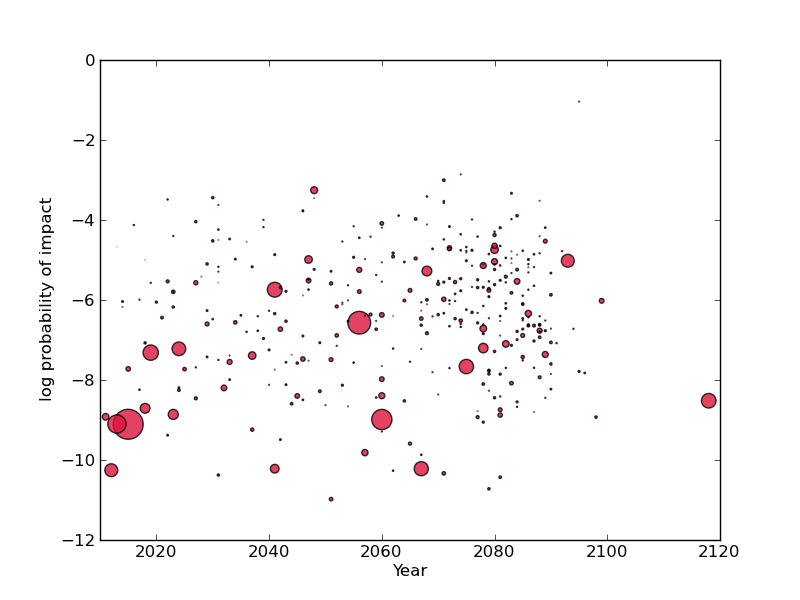
These are logarithms of impact probabilities over the next 100 years or so, based on ESA data. Sizes of dots are proportional to volumes of meteorites (assuming they are spherical): the largest one corresponds to 2010AU118, a 1200 m diameter rock that’s supposed to fly nearby sometime in 2015. The smallest object in the sample is 2 meters across.
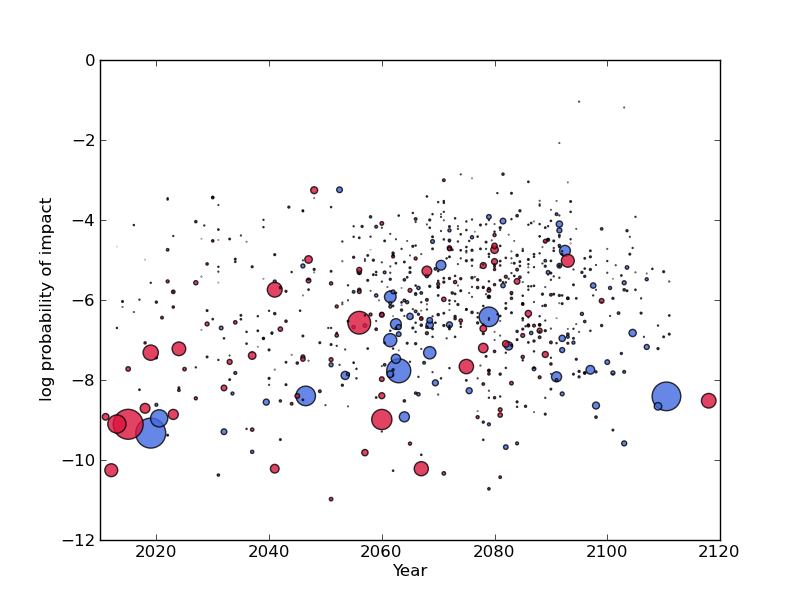
NASA also maintains its impact risk table, without any machine-friendly download options, however. rxdtxd, being a very technical boy, used a tangle of regexps to parse it (I’d have gone with the Beautiful Soup, as I’m lazy). Some of the objects in these tables match.
The NASA table is curious: they do not provide possible impact dates, only intervals when an object might be of any danger. And they probably calculate impact probabilities in a different way than ESA. I used the middle year of those intervals as a possible impact date in the following plot, which throws the NASA and ESA data together.
A possibility of an impact tells us pretty nothing: the consequences depend on the atmospheric entry angle, composition and velocity of the object, impact location (water or rock), etc. (I didn’t know before that asteroids can graze Earth’s atmosphere and fly away). I couldn’t find the exact energy yield equations during a quick browse-around, but here are a few more or less serious calculators and an article by E. Oepik from 1958. He was an Estonian astronomer way ahead of his time. We are actually quoting his letter on galaxy inclinations from 1923 in one of our scholarly papers!
Both NASA and ESA datasets offer two scales to evaluate the actual threats raised by near-Earth objects, that is, the Torino and Palermo scales, both combining impact probabilities and yields (kinetic energies). The former, I think, is for the mainstream media mainly – it gives a convenient, quite subjective indication of level of concern warranted. Currently there is 1 known object with a non-zero Torino scale rating.
The Palermo scale is rather complex, but more objective: it denotes relative risks with respect to background. Go read more about it here.
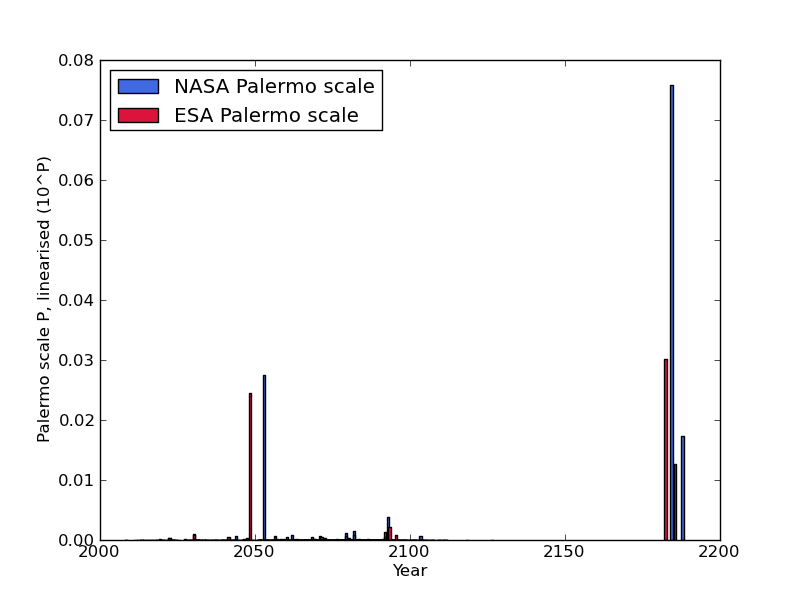
The ESA and NASA Palermo ratings do not match, though they correlate: they must be calculating the impact probabilities differently, and NASA does not provide timing for separate impact events.
If one sums up the impact probabilities, she gets 0.101-0.09 for ESA and NASA respectively. These are probabilities that we will be hit by an object we already know about. However, here’s the cumulative probability chart for ESA data:
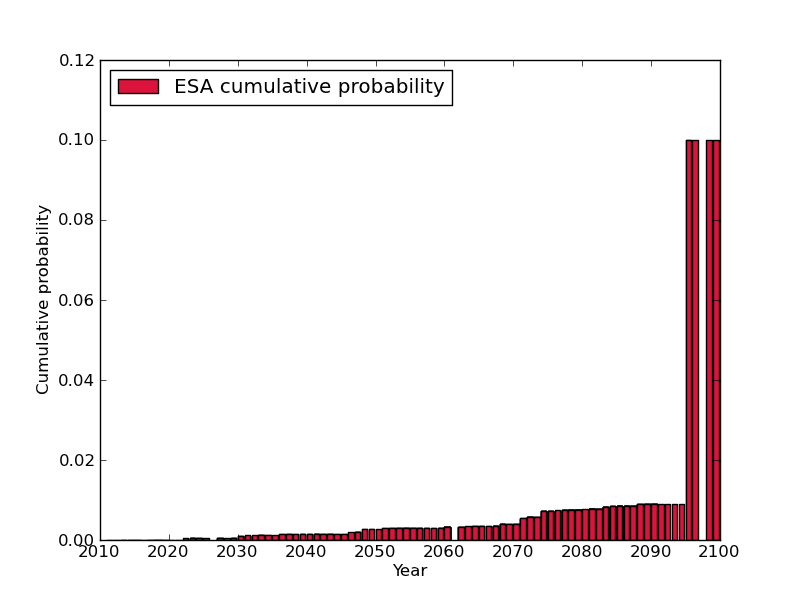
The gaps denote years that have no impact probability data, nevermind them. As you can see, the majority of that 0.101 probability is due to 2010RF12, which is a 9 m diameter rock (Chelyabinsk meteorite is assumed to be twice larger, although it entered at a very low angle). Which is to say, we’ll probably will be hit by a similar-sized meteorite before RF12’s presumed impact date (well, we were hit last week without any warning!).
The following is rather speculative.
I noticed that there is an overdensity of impact probabilities around 2080. The saying goes, ‘if you don’t know what to do with your data, do a Fourier transform’. Since FT does not work well on unevenly-spaced data, I used Lomb-Scargle analysis instead. Spectral analysis, such as L-S or Fourier analysis, is used in order to find any periodicities in time-series data, that is, finding dominant subcomponents of a signal, if there are any.
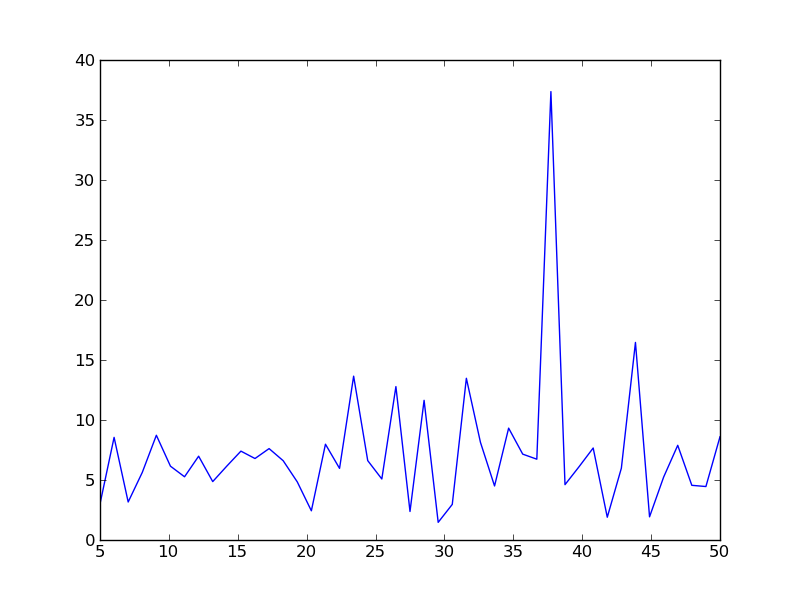
There might be a periodicity of ~37 years in the impact probabilities data, or it might be an artifact of rather short (~100 years) time interval available. It can be spurious, or maybe there is some orbital resonance with a group of NEOs.
One reason for the higher number of probable impact events at the end of this century might be the fact that impact probabilities are initially given larger values, and then revised downwards. As we learn of a flyby of a space rock, we know about its orbit with some certainty, and some close encounters alter the orbit of the asteroid enough to warrant attention later. (If you’re interested in what ‘a keyhole’ is, start here.) So far, chances that a known small asteroid will come back are smaller than chances of being hit by an unknown rock.
All code we used is here. I probably won’t be bothered to make it tidy.
Now the disclaimer: my research area is the galaxies and quasars. I know squat about the Solar System, except that Pluto is not a planet anymore. Don’t panic, but don’t throw away your Kalashnikov and the cans of condensed milk yet.